

Which age group was affected by the covid the most?
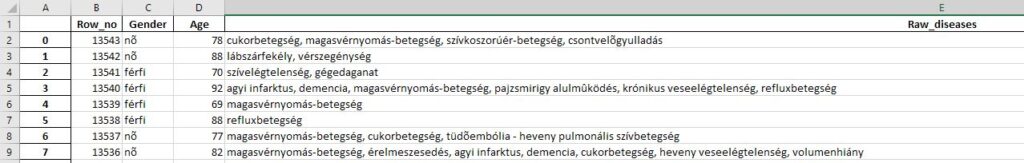
In the middle of the pandemic, when the statistical offices started issuing the reports on the deaths, my friends and I became curious as to who was most affected by covid depending on their age. We would like to compare this with the average mortality statistics that are not of covid origin. That’s why I wrote a web scraper that collects the data of the deceased and makes it comparable with each other . Unfortunately, the website is no longer active, but I have attached the collected datas from the site.
from bs4 import BeautifulSoup
import requests
import datetime
import time
import pandas as pd
url_base='https://koronavirus.gov.hu/elhunytak'
url_list = []
url_list.append(url_base)
for i in range(1, 270+1):
url = url_base + '?page=' + str(i)
url_list.append(url)
url = requests.get(url_base).content
soup = BeautifulSoup(url,'html.parser')
df = pd.DataFrame(columns=('Row_no', 'Gender', 'Age', 'Raw_diseases'))
for i in url_list:
url = requests.get(i).content
soup = BeautifulSoup(url,'html.parser')
for x in range(len(soup.tbody.contents)):
if len(soup.tbody.contents[x])>1:
row_data_obj = soup.tbody.contents[x]
row_no = int(row_data_obj.find('td', attrs={'class': 'views-field views-field-field-elhunytak-sorszam'}).text.strip())
gender = row_data_obj.find('td', attrs={'class': 'views-field views-field-field-elhunytak-nem'}).text.strip()
age = int(row_data_obj.find('td', attrs={'class': 'views-field views-field-field-elhunytak-kor'}).text.strip())
raw_diseases = row_data_obj.find('td', attrs={'class': 'views-field views-field-field-elhunytak-alapbetegsegek'}).text.strip()
print(row_no,gender,age,raw_diseases)
df = df.append({'Row_no' : row_no,
'Gender' : gender,
'Age' : age,
'Raw_diseases' : raw_diseases},
ignore_index=True)
# Save the raw df /if needed lately/
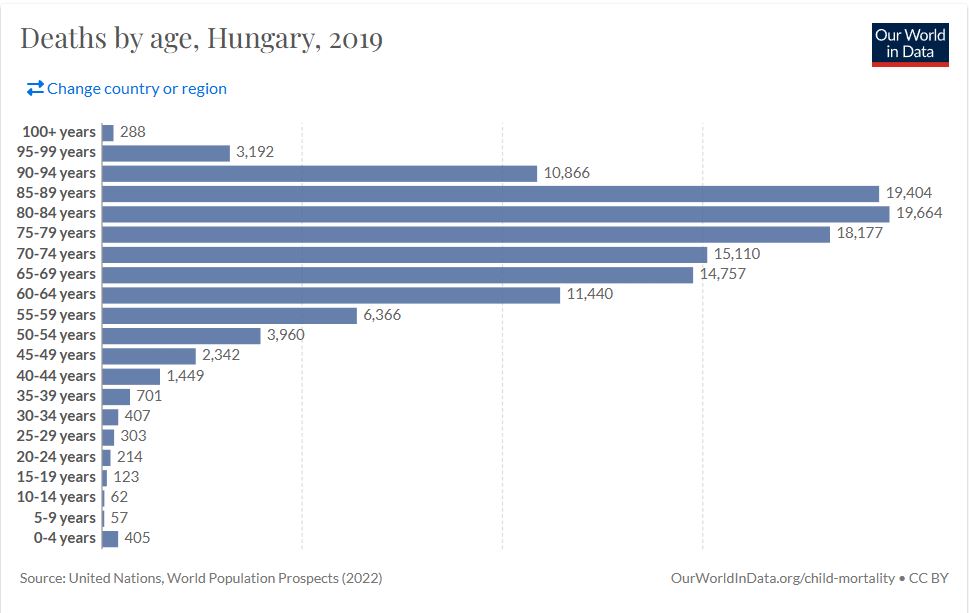
df.to_excel('covid_stat.xlsx')In order to be able to compare with the previous annual statistics, I downloaded the 2019 “Deaths by age” datas and put in an excel file. I get the datas from ourworldindata.org .
Now let’s compare the datas. To do that I recreate the same bins first from my dataset. The scale the datas to the same range /0 to 1/.
death_df = df.copy()
death_by_years_df = pd.read_excel(r"C:\Users\menem\Desktop\danielnemetheu\covid\death_by_years.xlsx")

bins = [0, 5, 10, 15, 20, 25, 30, 35, 40, 45, 50, 55, 60, 65, 70, 75, 80, 85, 90, 95, 100, 200]
Age_bin = death_df['Age'].value_counts(bins=bins).to_frame().sort_index().reset_index()
death_by_years_df['Age'] = Age_bin['Age']

from sklearn.preprocessing import MinMaxScaler
scaler = MinMaxScaler(feature_range = (0, 1))
death_by_years_df['Death_no'] = scaler.fit_transform(death_by_years_df[['Death_no']])
death_by_years_df['Age'] = scaler.fit_transform(death_by_years_df[['Age']])
death_by_years_df.rename(columns = {'Death_no' : 'Average Death no. before covid',
                                    'Age' : 'Covid Death no. after covid'}, inplace = True)

# Barplot
import matplotlib.pyplot as plt
ax = death_by_years_df.plot(kind="bar", x='year_range',
                       title='Death occurence density before and after covid by age')
ax.set(xlabel='Year Range', ylabel='Occurence density')
plt.show()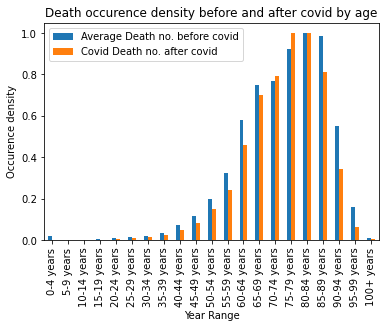
As seen after plotting the covid morely affect to the ages from 70 to 84. These people are the most affected by the covid regarding the age. I would like to made a comparision with the raw deseases but I do not have the knoledge to categorize the raw illness and them group. Whit that the statistic could be more sophisticated however currently there are a lot of statictic could be found on the internet about this.